What is ggplot2
ggplot2 is a plotting system for R, based on the grammar of graphics, which tries to take the good parts of base and lattice graphics and none of the bad parts. It takes care of many of the fiddly details that make plotting a hassle (like drawing legends) as well as providing a powerful model of graphics that makes it easy to produce complex multi-layered graphics. – http://ggplot2.org/
Theme element functions
element_text()
Purpose: To control the drawing of labels and headings.
The table below lists the arguments of element_text() and their corresponding default values.
| Argument | Description | Default value |
|---|---|---|
| family | font family | “” |
| face | font face | “plain” |
| colour | font color | “black” |
| size | font size (pts) | 10 |
| hjust | horizontal justification | 0.5 |
| vjust | vertical justification | 0.5 |
| angle | text angle | 0 |
| lineheight | line height | 1.1 |
element_line()
Purpose: To draw lines and segments such as graphics region boundaries, axis tick marks and grid lines.
| Argument | Description | Default value |
|---|---|---|
| colour | line color | “black” |
| size | line thickness | 0.5 |
| linetype | type of line | 1 |
element_rect()
Purpose: To draw rectangles. It is mostly used for background elements and legend keys.
| Argument | Description | Default value |
|---|---|---|
| fill | fill color | NA (none) |
| colour | border color | “black” |
| size | thickness of border line | 0.5 |
| linetype | type of border line | 1 (solid) |
element_blank()
Purpose: To draw nothing.
Arguments: none.
The element_blank() function can be applied to any theme element controlled by a theme element function.
With these functions in place, we now turn to the theme elements themselves.
Theme elements
Axis attributes
The table below lists each theme element associated with the rendering of axes, the theme function or unit function that controls it, and a short description of the element.
| Element | Theme function | Unit | Description |
|---|---|---|---|
| axis.line | line | line parallel to axis | |
| axis.text | text | tick labels | |
| axis.text.x | text | x-axis tick labels | |
| axis.text.y | text | y-axis tick labels | |
| axis.title | text | axis titles | |
| axis.title.x | text | x-axis title | |
| axis.title.y | text | y-axis title | |
| axis.ticks | line | axis tick marks | |
| axis.ticks.length | cm | length of tick marks | |
| axis.ticks.margin* | cm | width of axis tick margin |
`axis.ticks.margin` is deprecated. Please set `margin` property of `axis.text` instead
Legend attributes
The following theme elements are associated with the appearance of legends:
| Element | Theme function | Unit | Default value | Description |
|---|---|---|---|---|
| legend.background | rect | legend background | ||
| legend.key | rect | background of legend keys | ||
| legend.key.size | lines | |||
| legend.key.height | cm | legend key height | ||
| legend.key.width | cm | legend key width | ||
| legend.margin | lines | legend margin | ||
| legend.text | text | legend labels | ||
| legend.text.align | NULL | legend label alignment | ||
| legend.title | text | legend name | ||
| legend.title.align | NULL | legend name alignment | ||
| legend.position | “right” | position of legend | ||
| legend.direction | horizontal/vertical | NULL | direction of legend keys | |
| legend.justification | “center” | justification of legend | ||
| legend.box | horizontal/vertical | NULL | position of multiple legend boxes |
|
1 2 3 4 5 6 7 |
p0 + theme( legend.key = element_rect(fill = "yellow", color = "orange"), legend.key.width = unit(0.5, "in"), legend.key.height = unit(0.2, "in") ) |
The following table summarizes the possible values for each legend theme element associated with positioning:
| Theme element | Potential values |
|---|---|
| legend.direction, legend.box | “vertical”, “horizontal” |
| legend.position | “top”, “bottom”, “left”, “right” “none” |
| legend.justification | 1st value: “left”, “center”, “right” |
| 2nd value: “top”, “center”, “bottom” |
Panel attributes
Panel elements are associated with the graphics region in a ggplot. In faceted ggplots, these elements apply uniformly to each graphics panel.
| Element | Theme function | Unit | Description |
|---|---|---|---|
| panel.background | rect | background of graphics region | |
| panel.border | rect | border of graphics region | |
| panel.grid.major | line | major grid lines | |
| panel.grid.minor | line | minor grid lines | |
| panel.margin | lines | margin between facets |
Plot attributes
These elements pertain to the entire graphics region of a ggplot, but particularly outside a graphics panel (or the set of panels in a faceted plot).
| Element | Theme function | Unit | Description |
|---|---|---|---|
| plot.background | rect | background of entire plot | |
| plot.title | text | plot title | |
| plot.margin | cm | vector of margins around plot |
Sigmaplot Chart Standard
Title: Arial 14 Axis Title: Arial 12 Axis Text: Arial 10 Legend Text: Arial 10 All line thickness: 0.01in Major Tick Length: 0.05in Minor Tick Length: 0.03in
Dual axes
Follow instruction and code here. Notes: following packages needed:
|
1 2 3 4 5 |
library(ggplot2) library(gtable) library(grid) |
legend does not work, fix with here and the following code:
|
1 2 3 4 5 6 7 8 9 10 11 12 13 14 15 16 17 18 19 20 21 22 23 24 25 26 27 28 29 30 31 32 33 34 35 36 37 38 39 40 41 42 43 44 45 46 47 48 49 50 |
## dual axis function ggplot_dual_axis = function(plot1, plot2, which.axis = "x") { # Update plot with transparent panel plot2 = plot2 + theme(panel.background = element_rect(fill = NA)) grid.newpage() # Increase right margin if which.axis == "y" if(which.axis == "y") plot1 = plot1 + theme(plot.margin = unit(c(0.7, 1.5, 0.4, 0.4), "cm")) # Extract gtable g1 = ggplot_gtable(ggplot_build(plot1)) g2 = ggplot_gtable(ggplot_build(plot2)) # Overlap the panel of the second plot on that of the first pp = c(subset(g1$layout, name == "panel", se = t:r)) g = gtable_add_grob(g1, g2$grobs[[which(g2$layout$name=="panel")]], pp$t, pp$l, pp$b, pp$l) # Steal axis from second plot and modify axis.lab = ifelse(which.axis == "x", "axis-b", "axis-l") ia = which(g2$layout$name == axis.lab) ga = g2$grobs[[ia]] ax = ga$children[[2]] # Switch position of ticks and labels if(which.axis == "x") ax$heights = rev(ax$heights) else ax$widths = rev(ax$widths) ax$grobs = rev(ax$grobs) if(which.axis == "x") ax$grobs[[2]]$y = ax$grobs[[2]]$y - unit(1, "npc") + unit(0.15, "cm") else ax$grobs[[1]]$x = ax$grobs[[1]]$x - unit(1, "npc") + unit(0.15, "cm") # Modify existing row to be tall enough for axis if(which.axis == "x") g$heights[[2]] = g$heights[g2$layout[ia,]$t] # Add new row or column for axis label if(which.axis == "x") { g = gtable_add_grob(g, ax, 2, 4, 2, 4) g = gtable_add_rows(g, g2$heights[1], 1) g = gtable_add_grob(g, g2$grob[[6]], 2, 4, 2, 4) } else { g = gtable_add_cols(g, g2$widths[g2$layout[ia, ]$l], length(g$widths) - 1) g = gtable_add_grob(g, ax, pp$t, length(g$widths) - 1, pp$b) g = gtable_add_grob(g, g2$grob[[7]], pp$t, length(g$widths), pp$b - 1) } # extract legend leg1 <- g1$grobs[[which(g1$layout$name == "guide-box")]] leg2 <- g2$grobs[[which(g2$layout$name == "guide-box")]] legc = gtable:::cbind_gtable(leg1, leg2, "first") g$grobs[[which(g$layout$name == "guide-box")]] <- gtable:::cbind_gtable(leg1, leg2, "first") grid.draw(g) # Note: Legend does not fit #g$heights[[6]] = unit(5, "cm") # Add more space for the legend - can adjust this to suit #grid.draw(g) # Draw it grid.draw(g) } |
Resources about themes
ggthemes for additional themes, a few publication theme for science, few, base and tufet details information about theme functions and elements here. A comprehensive tutorial is from here. yet another good site. inheritance tree can be ploted following here. default theme is theme_grey, theme_grey to list the full function code. theme_grey to list all the element.
|
1 2 3 |
theme_grey()$axis.title.x |
modify theme easily
|
1 2 3 4 5 6 7 8 9 |
#based on a existing theme theme_tan() <-theme_bw(base_size=16) + theme(plot.title=element_text(margin = margin(5, 0, 15, 0),size=rel(1.2),face="bold"), axis.title.x=element_text(margin = margin(10, 0, 0, 0),face="bold"), axis.title.y=element_text(margin = margin(0, 10, 0, 0),face="bold")) # or %+replace% to replace, anything did not touch in the children elements will be set to NULL |
Random Notes
note-1
| name | what is it | example code |
|---|---|---|
| lineheight | space between lines | g+theme(plot.title = element_text(size=20, face=”bold”, vjust=1, lineheight=0.6)) |
| expression | expression | g<-g+labs(x=”Date”, y=expression(paste(“Temperature ( “, degree ~ F, ” )”)), title=”Temperature”) |
| vjust | Move the labels away from the plot (and add color) | g + theme(axis.title.x = element_text(color=”forestgreen”, vjust=-0.35),axis.title.y = element_text(color=”cadetblue” , vjust=0.35) ) |
| ylim(), scale_x_continuous(), coord_cartesian() | ylim(), scale_x_continuous(), coord_cartesian() | |
| name | change legend name | g+theme(legend.title = element_text(colour=”chocolate”, size=16, face=”bold”))+scale_color_discrete(name=”This color is\ncalled chocolate!?”) |
| legend.key | legend background box | g+theme(legend.key=element_rect(fill=’pink’)) |
| guides(), guide_legend | size of legend symbols | g+guides(colour = guide_legend(override.aes = list(size=4))) |
note-2
-
axis ticks face inwards in ggplot2.
12345678910library(ggplot2)library(grid)ggplot(mtcars, aes(disp, mpg)) + geom_point() + theme_bw()+theme(axis.ticks.length=unit(-0.25, "cm"),# ***has to be set individually***axis.text.x=element_text(margin=margin(20)),axis.text.y=element_text(margin=margin(r=20)))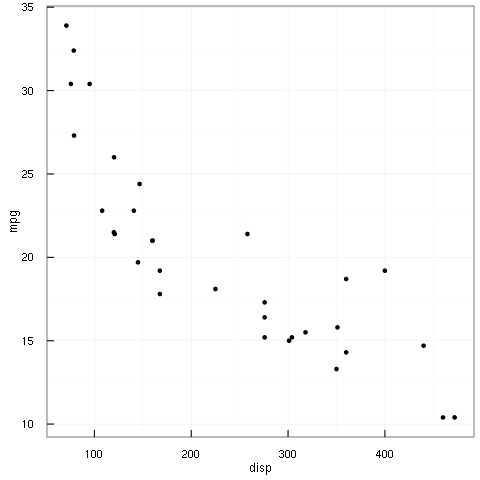
-
debug and margin for text (has to set individually for each axis as of version 2.1)
12345678910library("ggplot2")df <- data.frame(x = 1:3, y = 1:3)plot <- ggplot(df, aes(x, y)) +geom_point() +ggtitle("An important plot")plotplot + theme(plot.title = element_text(margin = margin(b = 20)))plot + theme(text = element_text(debug = TRUE))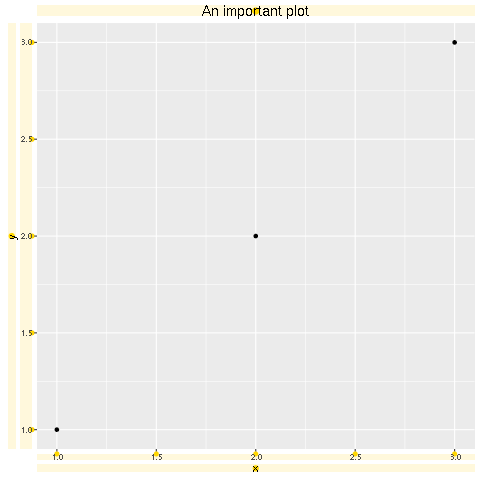
-
border
123456789library("ggplot2")ggplot(mtcars, aes(disp, mpg)) + geom_point() + theme_bw()+theme(axis.ticks.length=unit(-0.25, "cm"))+theme(axis.text.x = element_text(margin=margin(t=20)),axis.text.y = element_text(margin=margin(r=20)),axis.line.x=element_line(size=0.5),panel.border=element_rect(size = 1,linetype = "solid",color = "red"))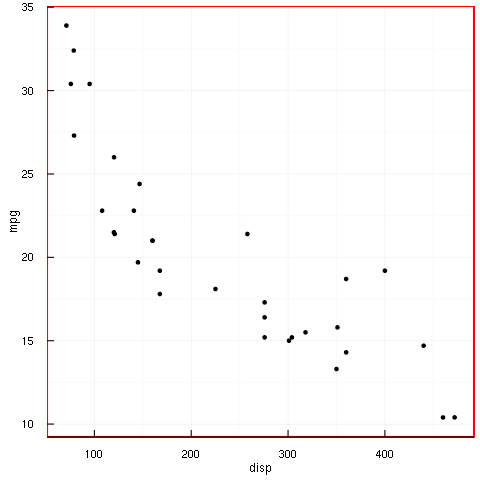
Stat_Summary
|
1 2 3 4 5 6 7 |
stat_sum_df <- function(fun, geom="crossbar", ...) { stat_summary(fun.data=fun, colour="red", geom=geom, width=0.2, ...) } d + stat_sum_df("mean_cl_boot") d + stat_sum_df("mean_cl_normal", geom = "errorbar") |
Plot against index
|
1 2 3 4 5 6 7 |
df %>% gather(key, value, -id, -time) %>% extract(key, c("question", "loop_number"), "(Q.\\..)\\.(.)") %>% spread(question, value) |
MAY
About the Author:
Beyond 8 hours - Computer, Sports, Family...