
Preamble
Stay Home and Be Safe!!
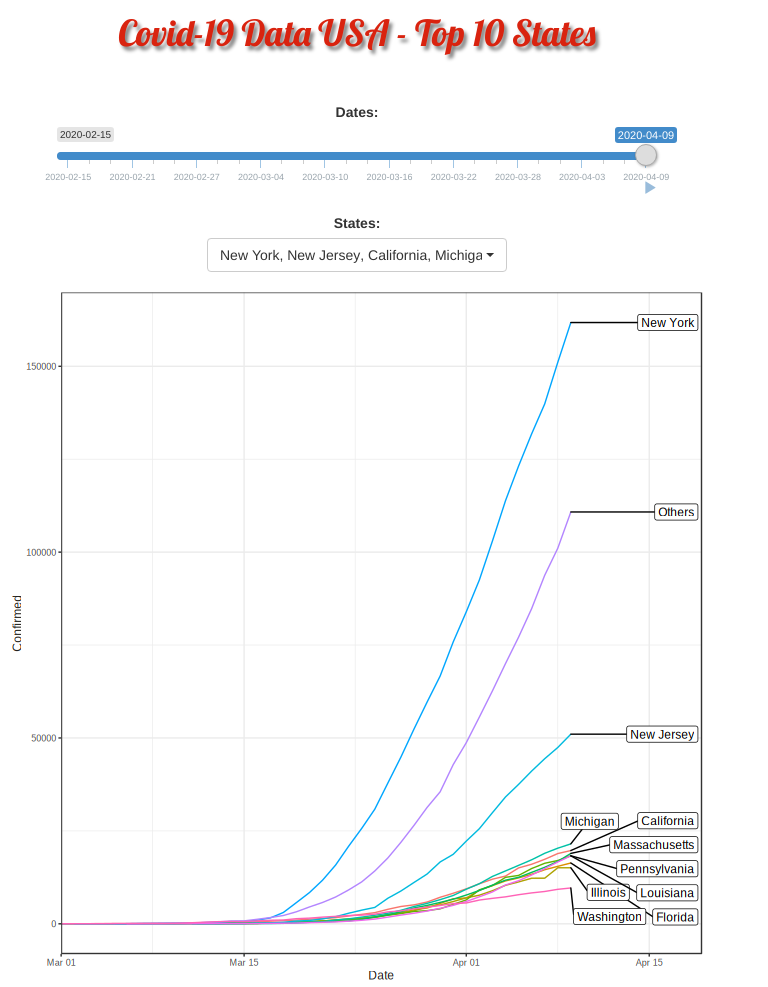
Covid-19 put the whole world on hold indefinitely. US is now leading partially due to the idling federal government. Yet different states is taking its own pace. This R shiny appz allows me to dissected deeper at each top-10 heavily contracted states and compare them side by side.
R Shiny Code
|
1 2 3 4 5 6 7 8 9 10 11 12 13 14 15 16 17 18 19 20 21 22 23 24 25 26 27 28 29 30 31 32 33 34 35 36 37 38 39 40 41 42 43 44 45 46 47 48 49 50 51 52 53 54 55 56 57 58 59 60 61 62 63 64 65 66 67 68 69 70 71 72 73 74 75 76 77 78 79 80 81 82 83 84 85 86 87 88 89 90 91 92 93 94 95 96 97 98 99 100 101 102 103 104 105 106 107 108 109 110 111 112 113 114 115 116 117 118 119 120 121 122 123 124 125 126 127 128 129 130 131 132 133 134 135 136 137 138 139 140 141 |
## install packages if not already list.of.packages <- c("shiny","shinythemes","shinyWidgets","ggplot2","ggrepel","lubridate", "tidyverse","magrittr","dplyr","viridis", "gganimate","ggthemes") new.packages <- list.of.packages[!(list.of.packages %in% installed.packages()[,"Package"])] if(length(new.packages)) install.packages(new.packages) ## load the needed packages eval(parse(text=paste("library(",list.of.packages,")"))) ## Two US covid-19 CSV files from github filenames <- c('time_series_covid19_confirmed_US.csv', 'time_series_covid19_deaths_US.csv') url.path <- 'https://raw.githubusercontent.com/CSSEGISandData/COVID-19/master/csse_covid_19_data/csse_covid_19_time_series' ## download files to local download <- function(filename) { url <- file.path(url.path, filename) dest <- file.path('./data', filename) download.file(url, dest) } bin <- lapply(filenames, download) ## load raw csv data into R data.confirmed.us<-read.csv('./data/time_series_covid19_confirmed_US.csv') data.deaths.us<-read.csv('./data/time_series_covid19_deaths_US.csv') ## get date range n.col <- ncol(data.confirmed.us) dates <- names(data.confirmed.us)[13:n.col] %>% substr(2,8) %>% mdy() max.date <- max(dates) min.date <- min(dates) ## get top 10 ranking ## wrangling dataframe dt_us_rank <- data.confirmed.us %>% select(-c(UID,iso2,iso3,code3,FIPS,Admin2,Country_Region,Lat,Long_,Combined_Key)) %>% gather(key=date, value=count, -Province_State) %>% mutate(date = date %>% substr(2,8) %>% mdy()) %>% filter(date <=max.date) %>% group_by(Province_State) %>% summarise(confirmed=sum(count)) %>% select(c(Province_State, confirmed)) %>% group_by(Province_State) %>% summarise(confirmed = sum(confirmed)) %>% mutate(ranking = dense_rank(desc(confirmed))) ## top 10 list top_state <- dt_us_rank %>% filter(ranking <= 10) %>% arrange(ranking) %>% pull(Province_State) %>% as.character() %>% setdiff('Others') %>% c('Others') ## Shiny for Line Plot App server <- shinyServer(function(input, output) { ## reactive def for end_date end_date <- reactive({ input$dateSlider }) ## reactive def for top list top_list <- reactive ({ input$state }) ## reactive def for df in accordance to the chosen date range us_top_line <- reactive({ data.confirmed.us %>% select(-c(UID,iso2,iso3,code3,FIPS,Admin2,Country_Region,Combined_Key, Lat, Long_)) %>% mutate_all(~replace(., is.na(.), 0)) %>% gather(Date, Confirmed, -Province_State) %>% ## convert Date column in right format mutate(Date=substr(Date,2,8))%>% mutate(Date=mdy(Date)) %>% filter(Confirmed>0) %>% ## Top state + "Others" mutate(Province_State=ifelse(Province_State %in% top_state, as.character(Province_State), 'Others')) %>% filter(Date <=end_date()) %>% group_by(Province_State, Date) %>% summarise(Confirmed = sum(Confirmed)) %>% ## add label col mutate(label = if_else(Date == max(end_date()), as.character(Province_State), NA_character_)) }) ## line plot output$distPlot <- renderPlot({ ## repopulate df with chosen states list us_top <- us_top_line() %>% filter(Province_State %in% top_list()) ggplot(us_top, aes(x=Date, y=Confirmed, group=(Province_State))) + geom_line(aes(color=(Province_State))) + theme_bw() + ## labs(title=paste0('美国新冠病毒前10名州(更新至', max.date, ')')) + scale_x_date(limits = c(as.Date("2020-03-01"), as.Date(end_date()+days(10))), expand = c(0,0)) + geom_label_repel(aes(label = label), nudge_x = 20, ## direction = 'both', na.rm = TRUE) + scale_color_discrete(guide = FALSE) + theme( text = element_text(color = "#22211d"), plot.title = element_text(size= 16, hjust=0.5, color = "#4e4d47", margin = margin(b = 0.4, t = 0.4, l = 2, unit = "cm")), ) }, height=700, width=700,bg = "transparent") }) ui <- shinyUI(fixedPage( ## skin and themes ## theme = shinytheme("simplex"), tags$head( tags$script(src="https://cdn.mathjax.org/mathjax/latest/MathJax.js?config=TeX-AMS_CHTML"), tags$style(HTML(" @import url('//fonts.googleapis.com/css?family=Lobster|Cabin:400,700'); h1 {font-family: 'Lobster', cursive;} h1,h2 {font-weight: 500; line-height: 1.1; color: #d9230f; text-shadow: 3px 4px 4.9px rgba(3, 3, 3, 0.5);} h2 {color:green;} ")) ), fixedRow(align="center",h1("Covid-19 Data USA - Top 10 States")), fixedRow(align="center",br(),br()), fixedRow(align="center", sliderInput("dateSlider", "Dates:", min = as.Date("2020-02-15"), max = max.date, value = as.Date("2020-03-03"), step = days(1), timeFormat="%Y-%m-%d", width = "80%", animate = TRUE # animateOptions(days(1)) ), ), fixedRow(align="center", pickerInput("state","States:", choices=top_state, selected = c("New York","California"), options = list(`actions-box` = TRUE),multiple = TRUE) ), fixedRow(align="center", plotOutput("distPlot")), fixedRow(align="center",br(),br()) )) shiny::shinyApp(ui=ui,server=server) |
Screen Capture
Top 10 and Others
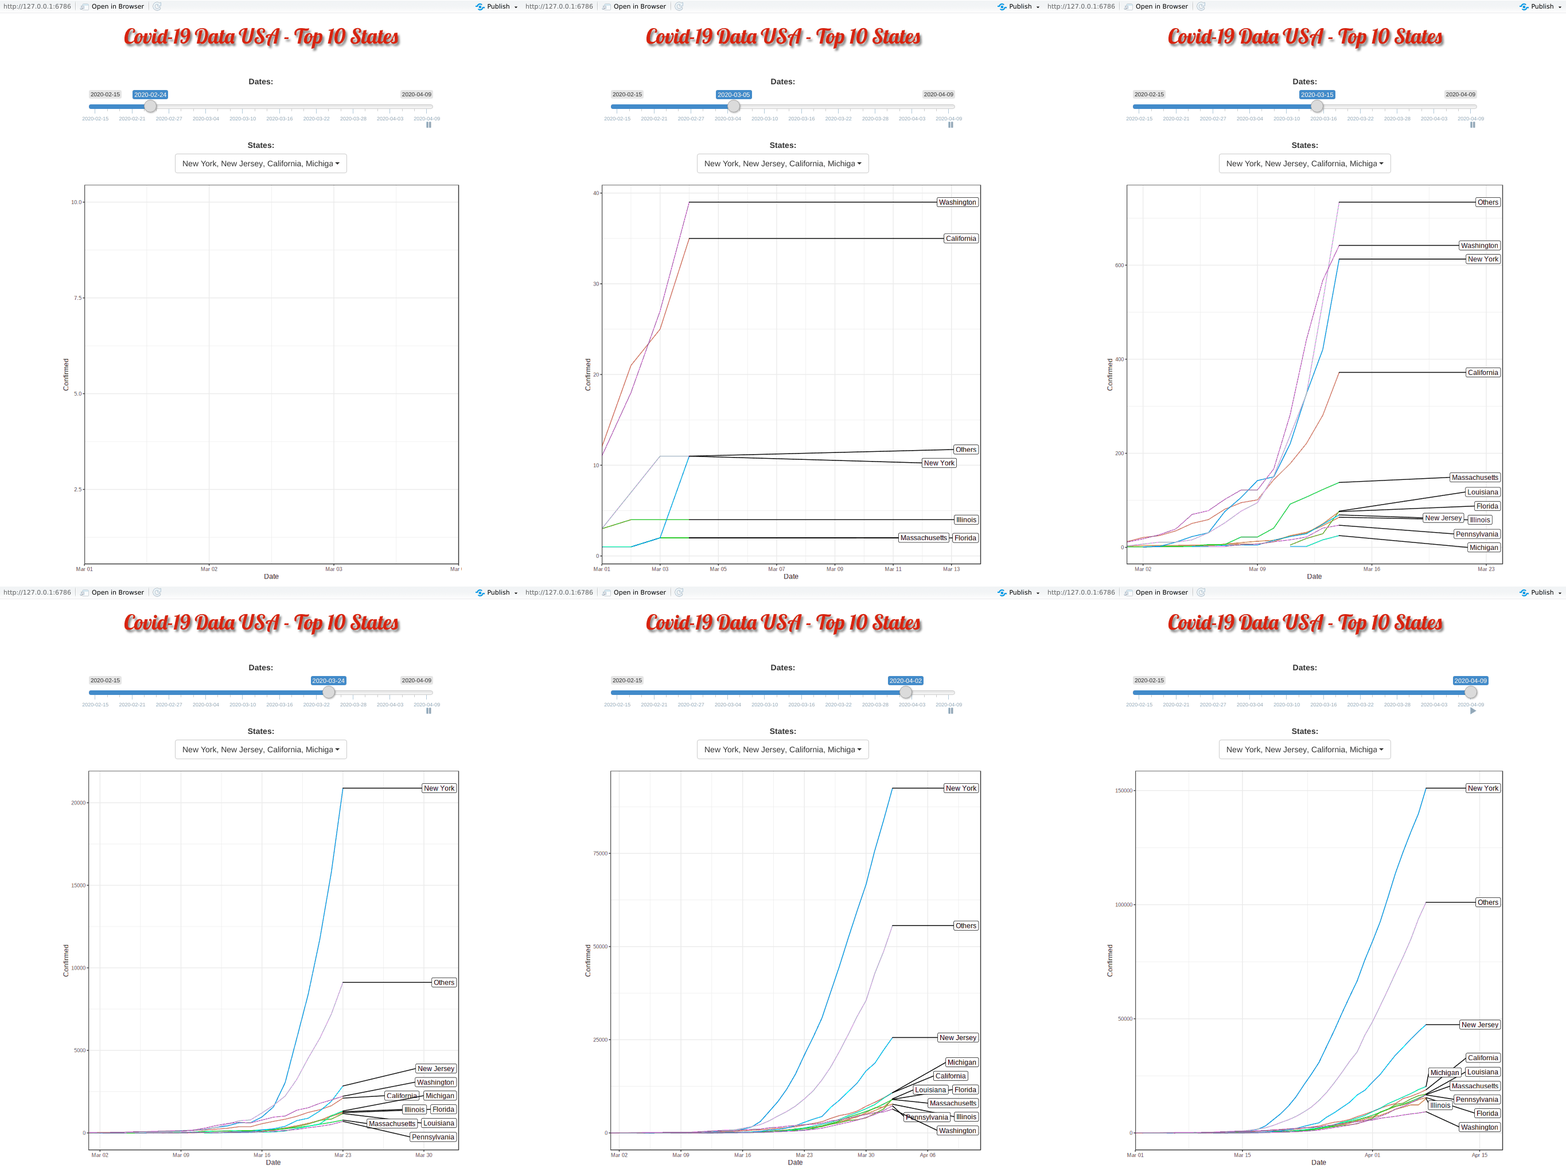
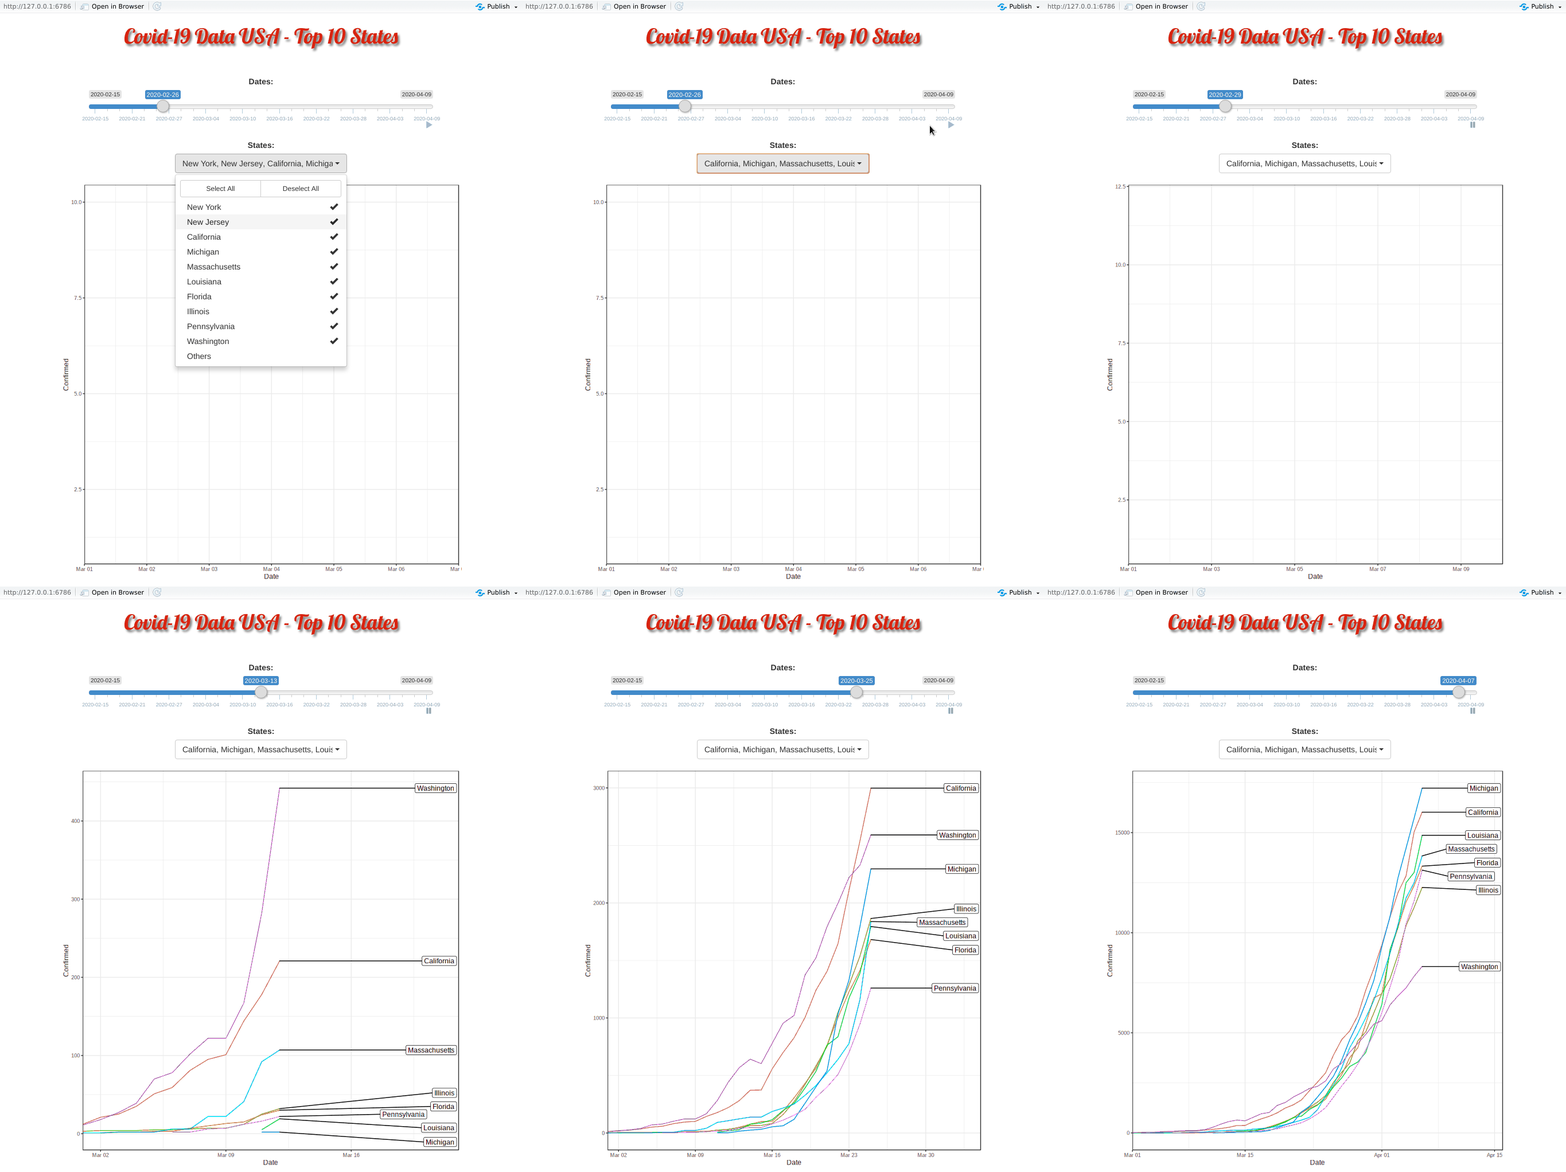
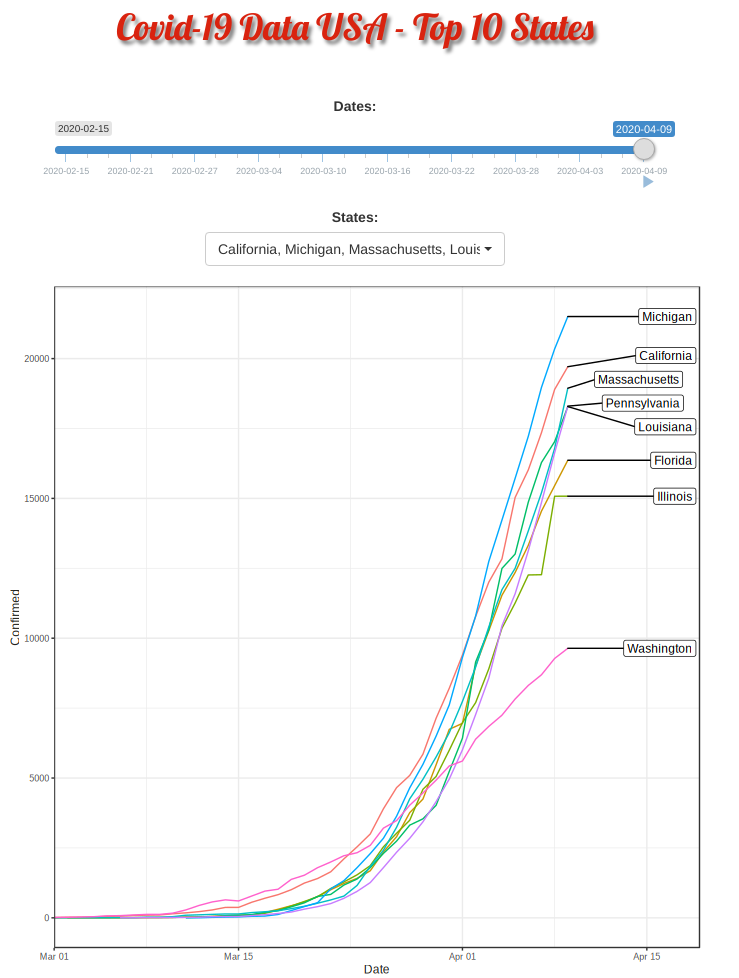
Covid-19 started in the west coast, Washington first and then California. Yet, as shown in the animation, New York, with a population of 1.9 million (half of California, 3.9 million), quickly took the lead and became the epicenter of the Covid-19 crisis.
The plausible reason for slowness of west coast maybe be due to their early enforcement of stay-at-home or shelter-in-place order. WSU is the first University closing their campus.
Top 10 Minus New York and New Jersey
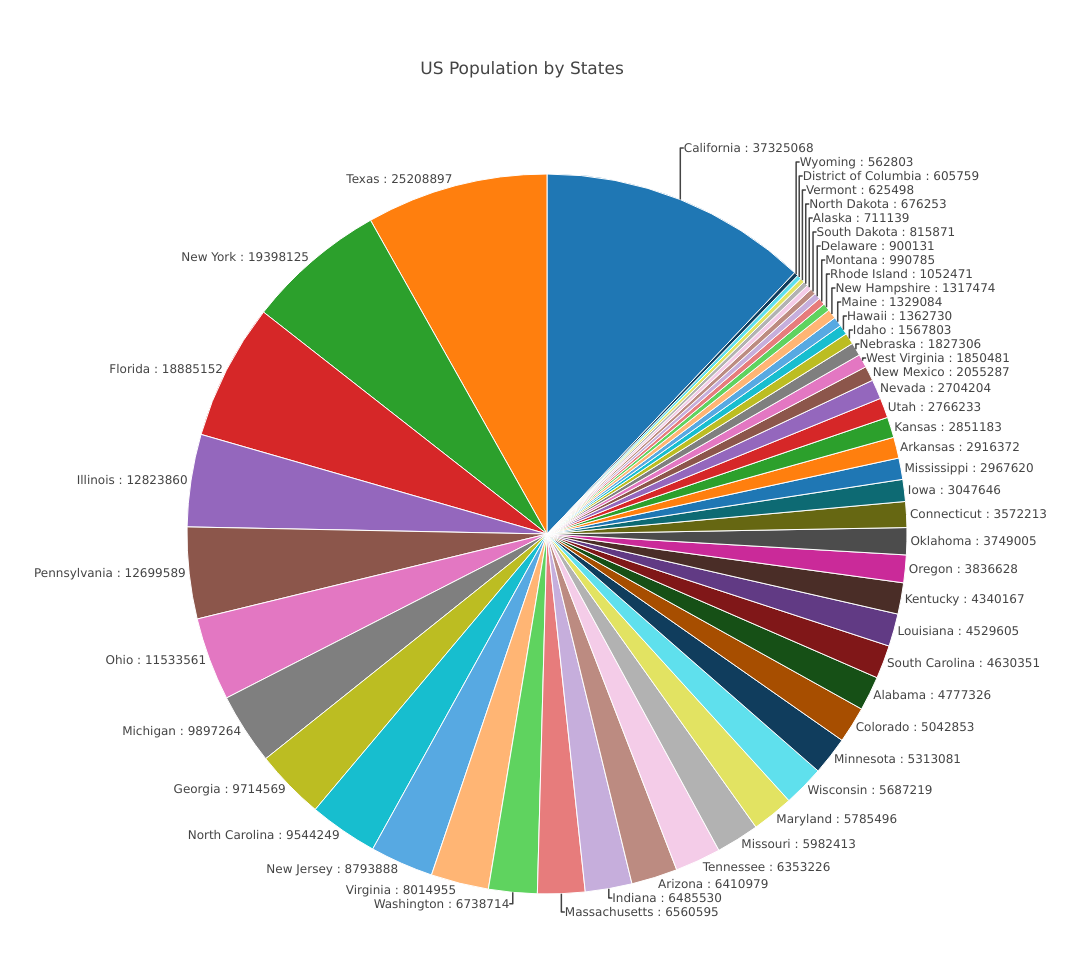
The US Population by States
|
1 2 3 4 5 6 7 8 9 10 11 12 13 14 15 16 17 18 19 20 21 22 23 24 25 26 27 28 29 30 31 |
library(choroplethr) library(plotly) data(df_pop_state) ## capitalize the first letter df_pop_state[,1] = tools::toTitleCase(df_pop_state[,1]) ## pie chart plot with plotly plot_ly(df_pop_state, labels = ~region, values = ~value, type = 'pie', ## label outside if per < 10% textposition = "outside", #ifelse(dt_us_top$value<12,"outside","inside"), textinfo = 'text', hoverinfo = 'text',source = "subset", marker = list(line = list(color = '#FFFFFF', width = 1)), ## txt=dt_us_top$txt text=~paste(region,":",value), ## text=~paste(txt), ## inside label color to white insidetextfont = list(color = '#FFFFFF'),width=1100, height=1000 ) %>% layout(title = "US Population by States", xaxis = list(showgrid = FALSE, zeroline = FALSE, showticklabels = FALSE), yaxis = list(showgrid = FALSE, zeroline = FALSE, showticklabels = FALSE), margin = list(b = 80,t=200) ) %>% layout(showlegend = FALSE,separators = ',.') %>% config(displayModeBar = F) |
APR

About the Author:
Beyond 8 hours - Computer, Sports, Family...