Preamble
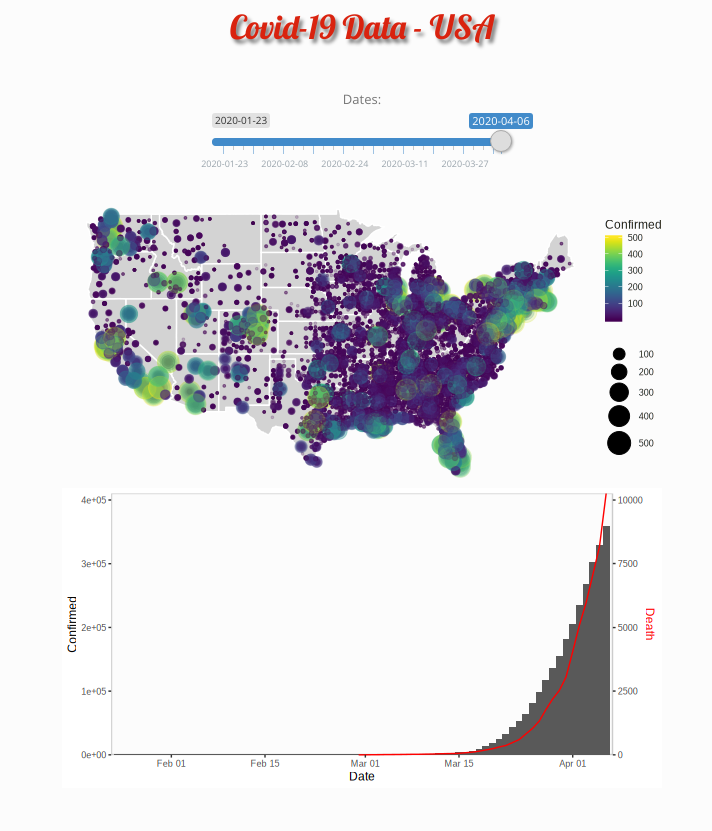
Shiny is an R package that makes it easy to build interactive web apps from R. This is an example demonstrating the dynamic distribution of Covid-19 data in USA.
The data source used for this analysis is the 2019 Novel Coronavirus COVID-19 (2019-nCoV) Data Repository1 built the Center for Systems Science and Engineering, Johns Hopkins University (GitHub – CSSEGISandData/COVID-19: Novel Coronavirus (COVID-19) Cases, provided by JHU CSSE).
The R code
The complete R Shiny code is as follows. Hopefully it is comprehensible with the comments.
|
1 2 3 4 5 6 7 8 9 10 11 12 13 14 15 16 17 18 19 20 21 22 23 24 25 26 27 28 29 30 31 32 33 34 35 36 37 38 39 40 41 42 43 44 45 46 47 48 49 50 51 52 53 54 55 56 57 58 59 60 61 62 63 64 65 66 67 68 69 70 71 72 73 74 75 76 77 78 79 80 81 82 83 84 85 86 87 88 89 90 91 92 93 94 95 96 97 98 99 100 101 102 103 104 105 106 107 108 109 110 111 112 113 114 115 116 117 118 119 120 121 122 123 124 125 126 127 128 129 130 131 132 133 134 135 136 137 138 139 140 |
## install packages if not already list.of.packages <- c("shiny","shinythemes","ggplot2","lubridate", "tidyverse","magrittr","dplyr","maps","ggmap","mapdata","gridExtra","viridis","ggforce","kableExtra", "gganimate","ggthemes") new.packages <- list.of.packages[!(list.of.packages %in% installed.packages()[,"Package"])] if(length(new.packages)) install.packages(new.packages) eval(parse(text=paste("library(",list.of.packages,")")))####load the needed packages ## Two CSV files from github filenames <- c('time_series_covid19_confirmed_US.csv', 'time_series_covid19_deaths_US.csv') url.path <- 'https://raw.githubusercontent.com/CSSEGISandData/COVID-19/master/csse_covid_19_data/csse_covid_19_time_series' ## download files to local drive download <- function(filename) { url <- file.path(url.path, filename) dest <- file.path('./data', filename) download.file(url, dest) } bin <- lapply(filenames, download) ## load data into R data.confirmed.us<-read.csv('./data/time_series_covid19_confirmed_US.csv') data.deaths.us<-read.csv('./data/time_series_covid19_deaths_US.csv') n.col <- ncol(data.confirmed.us) ## get dates from column names dates <- names(data.confirmed.us)[13:n.col] %>% substr(2,8) %>% mdy() max.date <- max(dates) min.date <- min(dates) states <- map_data("state") ## data for confrimed case dt_confirm <- data.confirmed.us %>% select(-c(UID,iso2,iso3,code3,FIPS,Admin2,Country_Region,Combined_Key)) %>% mutate_all(~replace(., is.na(.), 0)) %>% filter(Province_State!="C.") %>% gather(Date, Confirmed, -Province_State, -Lat, -Long_) %>% # convert Date column in right format mutate(Date=substr(Date,2,8))%>% mutate(Date=mdy(Date)) %>% filter(Confirmed>0) %>% # remove the 0 from plotting filter(Long_>-130 & Long_<0 & Lat > 20) # focus on mainland USA ## data for death (with "Population") dt_death <- data.deaths.us %>% select(-c(UID,iso2,iso3,code3,FIPS,Admin2,Country_Region,Combined_Key,Population)) %>% mutate_all(~replace(., is.na(.), 0)) %>% gather(Date, Death, -Province_State, -Lat, -Long_) %>% # convert Date column in right format mutate(Date=substr(Date,2,8))%>% mutate(Date=mdy(Date)) %>% filter(Death>0) %>% # remove the 0 from plotting filter(Long_>-130 & Long_<0 & Lat > 20) # focus on mainland USA ## Shiny App server <- shinyServer(function(input, output) { output$distPlot <- renderPlot({ start_date<-input$dateSlider dt <- dt_confirm %>% filter(Date <= start_date) ddt <- dt_death %>% filter(Date <= start_date) ## USA state map overlay with bubble plot p1 <- ggplot() + geom_polygon(data=states, aes(x=long, y=lat, group = group),color="white",alpha=0.2) + geom_point(data=dt, aes(x=Long_, y=Lat, size =Confirmed, color=Confirmed, alpha =Confirmed)) + scale_size(limits = c(1,500),range = c(.5,10),guide_legend(title=""))+ scale_alpha_continuous(range=c(0.2,0.4),guide = FALSE) + # turn off legend scale_color_viridis(limits = c(1,500)) + coord_fixed(1.3) + theme_void() + coord_map() + # labs(title=paste0('美国新冠病毒动态分布图- Date ', start_date)) + guides(fill=FALSE) + # do this to leave off the color legend theme( text = element_text(color = "#22211d"), plot.title = element_text(size= 16, hjust=0.5, color = "#4e4d47", margin = margin(b = 0.1, t = 0.4, l = 2, unit = "cm")), ) + guides(fill=FALSE) # do this to leave off the color legend ## summarise confirmed data dt %<>% group_by(Date) %>% summarise(Confirmed = sum(Confirmed)) %>% ungroup() ## summarise death data ddt %<>% group_by(Date) %>% summarise(Death = sum(Death)) %>% ungroup() ## Bar and line plot in time series with 2 y-axes p2 <- ggplot() + geom_col(data=dt, aes(x = Date, y = Confirmed)) + geom_line(data=ddt, aes(x=Date, y=Death*40), colour="red", group=1)+ scale_y_continuous(name = "Confirmed", expand = c(0,0), sec.axis = sec_axis(~./40, name = "Death")) + scale_fill_manual(values = c("#b2d1e0","gold")) + scale_x_date(limits = c(as.Date(min.date), as.Date(max.date+1)), expand = c(0,0)) + labs(x = "Date", y = "Confirmed") + theme(legend.position = "none", panel.grid.major = element_blank(), panel.grid.minor = element_blank(), panel.background = element_rect(fill = "grey99", colour = "grey80"), plot.title = element_text(hjust = 0.5), axis.title.y.right = element_text(color = "red")) grid.arrange(p1, p2, ncol=1) }, height=600, width=600,bg = "transparent") }) ui <- shinyUI(fixedPage( ## skin and themes ## theme = shinytheme("simplex"), tags$head( tags$script(src="https://cdn.mathjax.org/mathjax/latest/MathJax.js?config=TeX-AMS_CHTML"), tags$style(HTML(" @import url('//fonts.googleapis.com/css?family=Lobster|Cabin:400,700'); h1 {font-family: 'Lobster', cursive;} h1,h2 {font-weight: 500; line-height: 1.1; color: #d9230f; text-shadow: 3px 4px 4.9px rgba(3, 3, 3, 0.5);} h2 {color:green;} #distPlot{background:none !important; height:600px !important;} .irs {max-width: 800px;} ")) ), fixedRow(align="center",h1("Covid-19 Data - USA")), fixedRow(align="center",br(),br()), fixedRow(align="center", sliderInput("dateSlider", "Dates:", min = min.date, max = max.date, value=as.Date("2020-03-01"), width = "80%", timeFormat="%Y-%m-%d", animate = TRUE), ), fixedRow(align="center", plotOutput("distPlot")), fixedRow(align="center",br(),br()) )) shiny::shinyApp(ui=ui,server=server) |
The Screenshot

7
APR
APR

About the Author:
Beyond 8 hours - Computer, Sports, Family...