Web Scraping with Beautifulsoup
Beautiful Soup is a Python library for pulling data out of HTML and XML files. It works with your favorite parser to provide idiomatic ways of navigating, searching, and modifying the parse tree. It commonly saves programmers hours or days of work.
A Gentle Introduction to Overall Steps
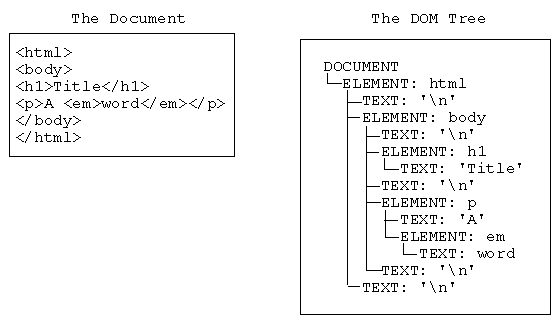
The HTML tags contained in the angled brackets provide structural information (and sometimes formatting), which we probably don’t care about in and of itself but is useful for selecting only the content relevant to our needs.

-
Parse a html or xml file or website to generate a nested tree data structure.
123456789import urllib.requestfrom bs4 import BeautifulSoup#open file to write dataf=open('/home/tan/proj/bs4/university-list.txt','w')url="http://www.utexas.edu/world/univ/alpha/"page = urllib.request.urlopen(url)soup = BeautifulSoup(page,"lxml") - Loop through the structure and filter needed information.
-
One common task is to extract all the URLs found within a page’s <a> tags, as in the university list example below:
12345for link in soup.find_all('a'):print(link.a.get_text()) #get textprint(link.get('href')) # and/or the href link -
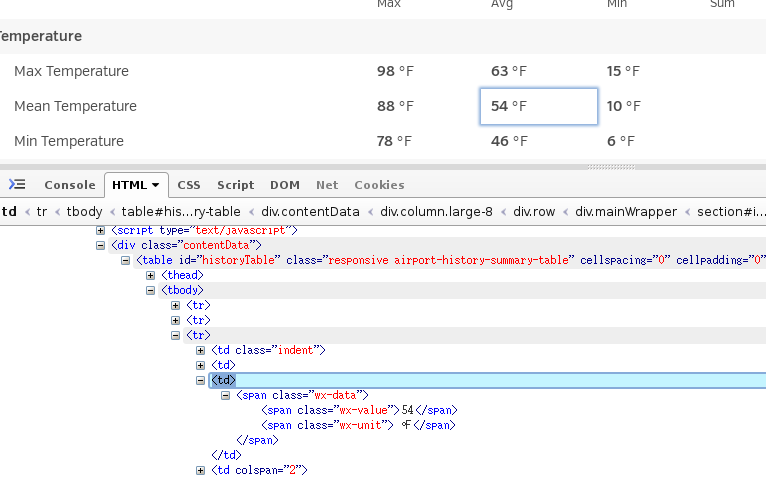
If needed, use firebug or other tools to located the desired information from the html source code.

- Enjoy your Beautiful Soup.
Installation and Setting up
I had some problems with the installation. Here is what worked for me.
|
1 2 3 4 |
sudo pip3 install BeautifulSoup4 pip install lxml html5lib #parsers |
If you got this error: ImportError: bad magic number in 'urllib': b'\x03\xf3\r\n' , to to this link here for solution:
This is caused by the linker pyc, have a look on the directory of your scripts, you may have used two differents versions of python exp 2… 3… etc just to rm -f the pyc file that causes the problem and you will fix it.
Make some Beautiful Soup -Enjoy!
How Many Univsersity in USA ?
Following script is adapted from somewhere which I could not seem to recall the origin.
|
1 2 3 4 5 6 7 8 9 10 11 12 13 14 15 16 17 18 19 20 21 22 23 24 |
#!/bin/python import os import urllib.request from bs4 import BeautifulSoup #open file to write data f=open('/home/tan/proj/bs4/university-list.txt','w') url="http://www.utexas.edu/world/univ/alpha/" page = urllib.request.urlopen(url) soup = BeautifulSoup(page,"lxml") #print the list the html file #print(soup.prettify()) count=0 universities=soup.find_all('a',class_='institution') for university in universities: url=university['href'] list=(university.string+"\t"+url) f.write(list+'\n') count+=1 # print the # of universities print("The Total Number of Universites in US is",count, ".") #close the file f.close() |
|
1 2 3 4 5 6 7 8 9 10 11 12 13 14 |
tail university-list.txt' ------------------------------------------------------------- University of Wyoming http://www.uwyo.edu/ Xavier University http://www.xavier.edu/ Xavier University of Louisiana http://www.xula.edu/ Yale University http://www.yale.edu/ Yeshiva University http://www.yu.edu/ York College http://www.york.edu/ York College of Pennsylvania http://www.ycp.edu/ Young Harris College http://www.yhc.edu/ Youngstown State University http://www.ysu.edu/ Zaytuna College https://www.zaytuna.edu/ |
|
1 2 3 4 |
wc -l university-list.txt 2163 university-list.txt |
so, there are 2163 Universties in USA as of this moment 11/18/2015 12:07:18 AM.
Local Climate for the last 100 Years ?
Weather underground is a wonderful site with climate-rich information.
-
Followig script can be used to look back into historic climate fluctuation (temperature only here).
123456789101112131415161718192021222324252627282930313233343536373839404142import urllib.requestfrom bs4 import BeautifulSoupimport time# link here: http://allisonlassiter.com/2014/02/16/scraping-wunderground-with-yau-beautiful-soup/ http://flowingdata.com/2007/07/09/grabbing-weather-underground-data-with-beautifulsoup/#Create/open a file called wunder.txt (which will be a csv)f = open('wunder-data_RC.txt', 'w')past=100 #looking back how many yearsy=time.strftime("%Y")d=time.strftime("%d")m=time.strftime("%m")#Format month for timestampif len(str(m)) < 2:mStamp='0'+str(m)else:mStamp = str(m)#Format day for timestampif len(str(d)) < 2:dStamp = '0' + str(d)else:dStamp = str(d)# Iterate through year, month, and dayfor y in range(int(y)-past, int(y)+1): #last 100 years#Open wundergorund.com urltimestamp = str(y) + str(m) + str(d)print("Getting data for " + timestamp)url = "http://www.wunderground.com/history/airport/KONT/"+str(y)+"/" + str(m) + "/" + str(d) + "/DailyHistory.html?req_city=Alta+Loma&req_state=CA&req_statename=California&reqdb.zip=91701&reqdb.magic=1&reqdb.wmo=99999" #RC weatherpage = urllib.request.urlopen(url)#Get temperature from pagesoup = BeautifulSoup(page,"lxml")# dayTemp = soup.body.nobr.b.stringdayTemp = soup.find_all(attrs={"class":"wx-data"})[2].span.string#Write timestamp and temperature to filef.write(timestamp + ',' + dayTemp + '\n')f.close() -
Some coding with python matplot to plot it.
123456789101112131415161718192021222324252627282930313233343536373839404142import matplotlib.pyplot as pltimport matplotlib.dates as mdatesfrom matplotlib.dates import YEARLY, rrulewrapper, RRuleLocatorimport numpy as np#byte converter needed for Python3, http://stackoverflow.com/questions/16496017/typeerror-when-using-matplotlibs-strpdate2num-with-python-3-2def bytedate2num(fmt):def converter(b):return mdates.strpdate2num(fmt)(b.decode('ascii'))return converterdatefunc =bytedate2num('%Y%m%d')# Read data from text filedates, temp = np.genfromtxt('wunder-data_RC.txt', # Data to be readunpack=True,delimiter=',',converters= {0: datefunc}) # Formatting of column 0fig = plt.figure()ax = fig.add_subplot(111)# tick every 5th easterrule = rrulewrapper(YEARLY, byeaster=1, interval=5)loc = RRuleLocator(rule)ax.xaxis.set_major_locator(loc)# Configure x-ticks#ax.set_xticks(dates) # Tickmark + label at every plotted pointax.xaxis.set_major_formatter(mdates.DateFormatter('%Y'))ax.plot_date(dates, temp, ls='-', marker='o')ax.set_title('Looking Back Last 100-Year Climate - Global Warming ?')ax.set_ylabel('Average Temperature')ax.grid(True)# Format the x-axis for dates (label formatting, rotation)fig.autofmt_xdate(rotation=45)fig.tight_layout()fig.show()fig.savefig('100-year-climate.png') -
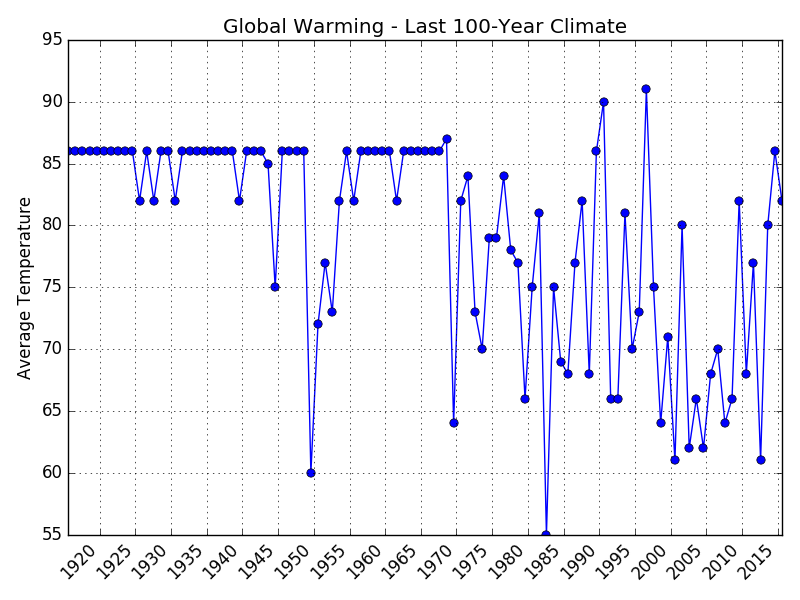
and here is the plot with quite some bad data points (I think).

NOV

About the Author:
Beyond 8 hours - Computer, Sports, Family...