
Preamble
Stay Home and Be Safe!!
Covid-19 put the whole world on hold indefinitely. US is now leading partially due to the idling federal government. Yet different states is taking its own pace. This R shiny appz allows me to dissected deeper at each top-10 heavily contracted states and compare them side by side.
R Shiny Code

Preamble
Shiny is an R package that makes it easy to build interactive web apps from R. This is an example demonstrating the dynamic distribution of Covid-19 data in USA.
The data source used for this analysis is the 2019 Novel Coronavirus COVID-19 (2019-nCoV) Data Repository1 built the Center for Systems Science and Engineering, Johns Hopkins University (GitHub – CSSEGISandData/COVID-19: Novel Coronavirus (COVID-19) Cases, provided by JHU CSSE). ...
APR
Covid-19 Data Visualization with R
Posted by: mistan
Data Source
UPDATE: JHU dataset changed its name and format, The data for USA and global are separated. The US data adapted a new format. Some amateur data scientists are in charge of the this project. 04-02-2020
The data source used for this analysis is the 2019 Novel Coronavirus COVID-19 (2019-nCoV) Data Repository1 built the Center for Systems Science and Engineering, Johns Hopkins University (GitHub ...
MAR
R Markdown
Posted by: mistan
What is rMarkdown?
R Markdown documents are fully reproducible. Use a productive notebook interface to weave together narrative text and code to produce elegantly formatted output. Use multiple languages including R, Python, and SQL. – rmarkdown official site
R Markdown supports dozens of static and dynamic output formats including HTML, PDF, MS Word, Beamer, HTML5 slides, Tufte-style handouts, books, dashboards, shiny applications, scientific articles, websites, and more. – rmarkdown official ...
MAY
About ggplot2 for R
Posted by: mistan
What is ggplot2
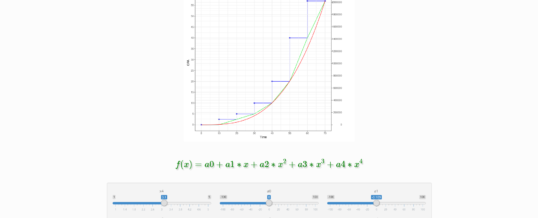
ggplot2 is a plotting system for R, based on the grammar of graphics, which tries to take the good parts of base and lattice graphics and none of the bad parts. It takes care of many of the fiddly details that make plotting a hassle (like drawing legends) as well as providing a powerful model of graphics that makes it easy to produce complex multi-layered graphics. – http://ggplot2.org/
Continue Reading →
26
MAY
Share
MAY
Web Scraping with R
Posted by: mistan
Web table scraping
Shiny is –
A web application framework for R Turn your analyses into interactive web applications No HTML, CSS, or JavaScript knowledge required.
Best place to learn is the tutorial from official site.
shiny package for R
Inspired and adapted from here. dplyer tutorial here, or its own documentation. Another tutorial for dplyr and tidyr; The cheatsheet is useful too, install the dataset from the page’s footnote devtools::install_github("rstudio/EDAWR").
magrittr: Simplifying R code with pipes
Workflow for statistical analysis with R
Posted by: mistan
NB: Quantitative = continuous
Categorical = Discrete
Uni-variable
| Variable | Charts | Statistics |
|---|---|---|
| Category | Bar Chart, Pie Chart | frequencies ->Chi Square |
| Quantitative | Box Plot, Histogram | descriptive -> single mean or proportion: Hypothesis test |
geom_bar. ggplot2 0.9.3.1geom_bar. ggplot2 0.9.3.1
The bar geom is used ...
MAY
R is a free software environment for statistical computing and graphics. The following is some basics about R data types.
Comparison of vector,list,matrix and dataframe
| vector | list | matrix | dataframe | |
|---|---|---|---|---|
| creation | c | list | matrix | data.frame |
| same type | Y | N | Y | N |
| class | class of its elements | list | matrix | data.frame |
MAY